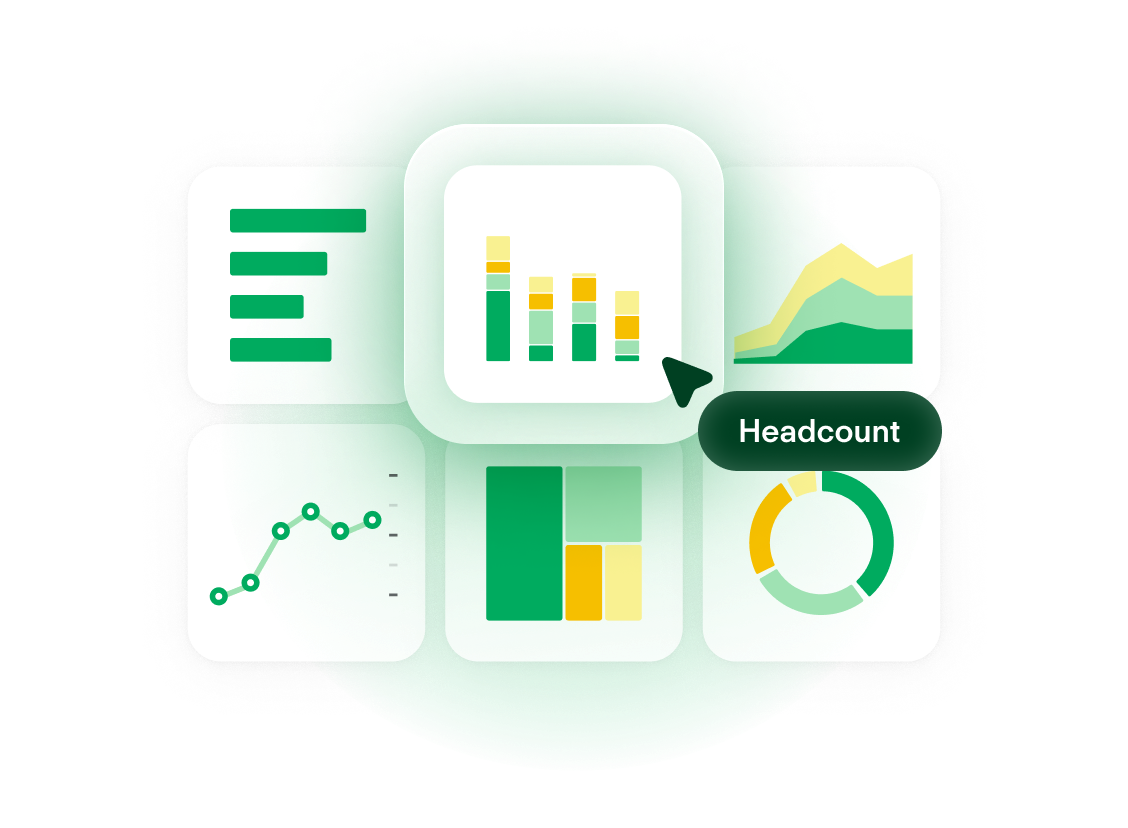
Turn data into strategic insights.
Enable proactive decision-making with People Analytics.
Create reports in secondsHR Dashboard: 6 Examples & Tips for Data-Driven HR Success
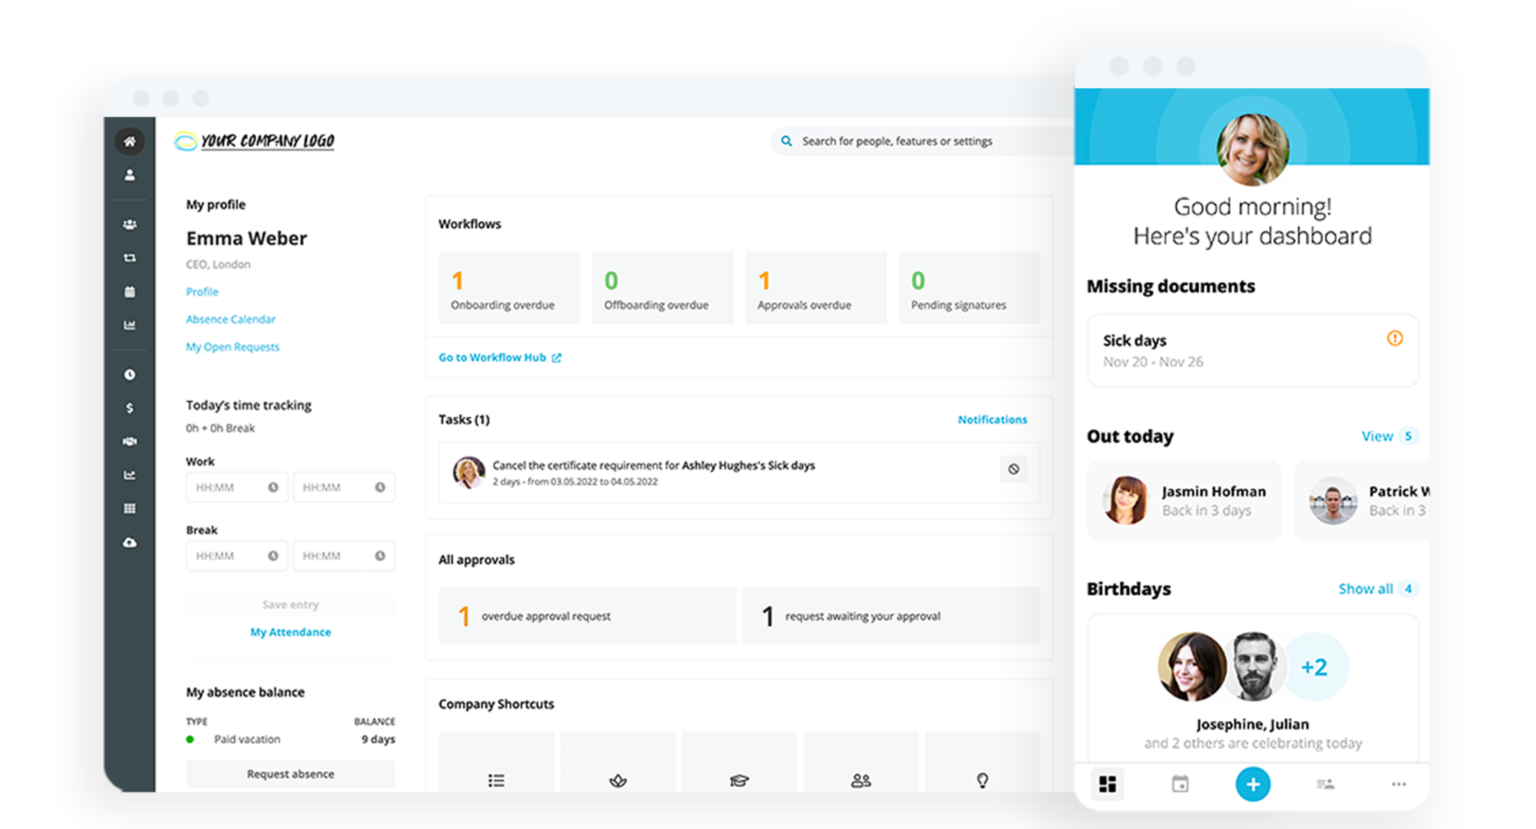
Is an HR dashboard right for the way your HR team works? In this guide, we uncover the exact definition of an HR dashboard, examples of HR dashboards and some of the most common HR metrics that are typically included as part of a fully-functional dashboard. Let’s dive in…
Personio offers an intuitive and reliable reporting and analytics dashboard. Take a look.What is an HR dashboard?
An HR dashboard is used to house and track various reports concerning HR-related metrics. It is a business intelligence tool that includes graphs, charts or lists. A great HR dashboard will show HR teams how their organisation is growing and performing.
Dashboards help managers track HR-related metrics. HR in startups and small-to-medium-sized businesses often struggle with reporting. Dashboards help analyse performance and report on broader trends by combining data from various HR systems.
Teams can create their own HR dashboards. However, they are much easier to view, track and drill down into when HR teams use reporting offered by their HR software.
Important features of HR dashboards
What are some of the most important features when it comes to HR dashboards? Here is what we would recommend:
Mobile-friendly interface: A responsive design for access on mobile devices ensures HR and employees can stay connected and make informed decisions on the go.
Automated reporting: Streamlines report generation and distribution, reducing manual effort and ensuring timely, accurate information.
Data visualisation: A great dashboard presents data in visually-engaging formats (e.g., charts, graphs) for quick understanding of trends and insights.
Real-time data updates: Up-to-the-minute information that enables HR teams to act swiftly based on the latest data.
Security and access controls: Ensures a high level of data protection and restricts access to only authorised personnel (safeguarding sensitive employee information).
Integration capabilities: Integrates with various HR systems and data sources, offering a unified view of information from multiple platforms.
Key performance indicators (KPIs): Allows users to define, track, and display HR KPIs to measure performance against organisational goals.
An easy-to-use HR management system
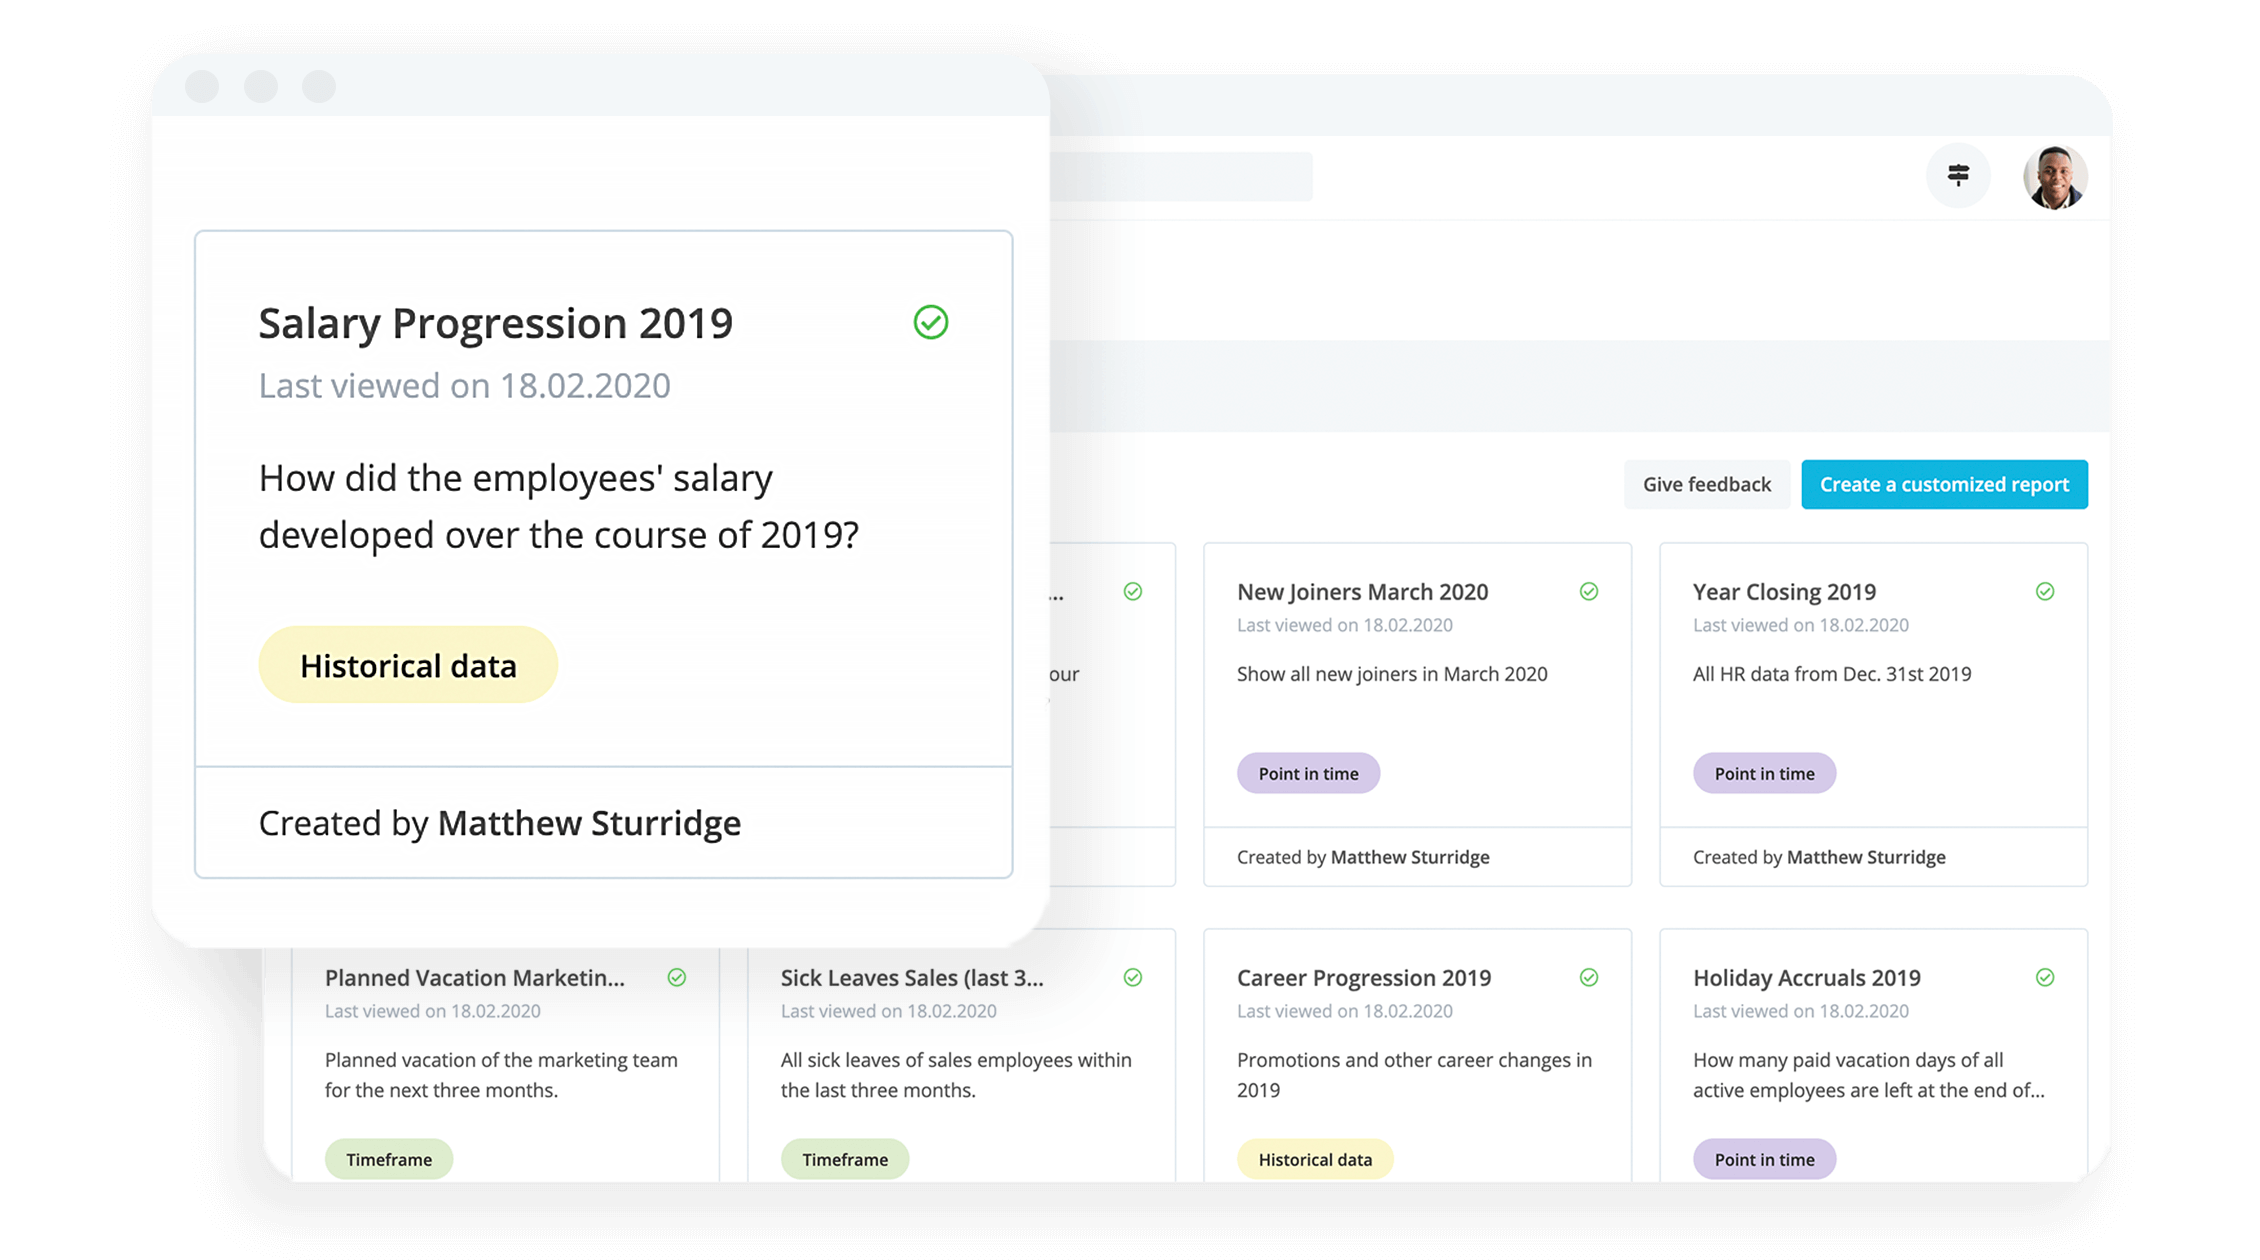
Personio offers an all-in-one HR solution, complete with a helpful and customisable dashboard, to make your people more reportable and more actionable. Click below to learn more about how it works and speak with an expert today.
Here's how it worksWhy are HR dashboards important?
HR dashboards are important because they help companies use their HR data to identify trends, make predictions and ensure that the business is on track. An HR dashboard can cover every stage of the employee lifecycle – from recruiting to hiring, training, retention and even off-boarding.
6 HR dashboard examples in action
An HR dashboard can help managers see the bigger picture, or drill down to see specifics. For example, you can use a dashboard to monitor overall employee performance. Or, you can get broader information or trends on your workforce and headcounts.
What follows are six examples of HR dashboards and why you might use them…
1. Employee performance dashboard
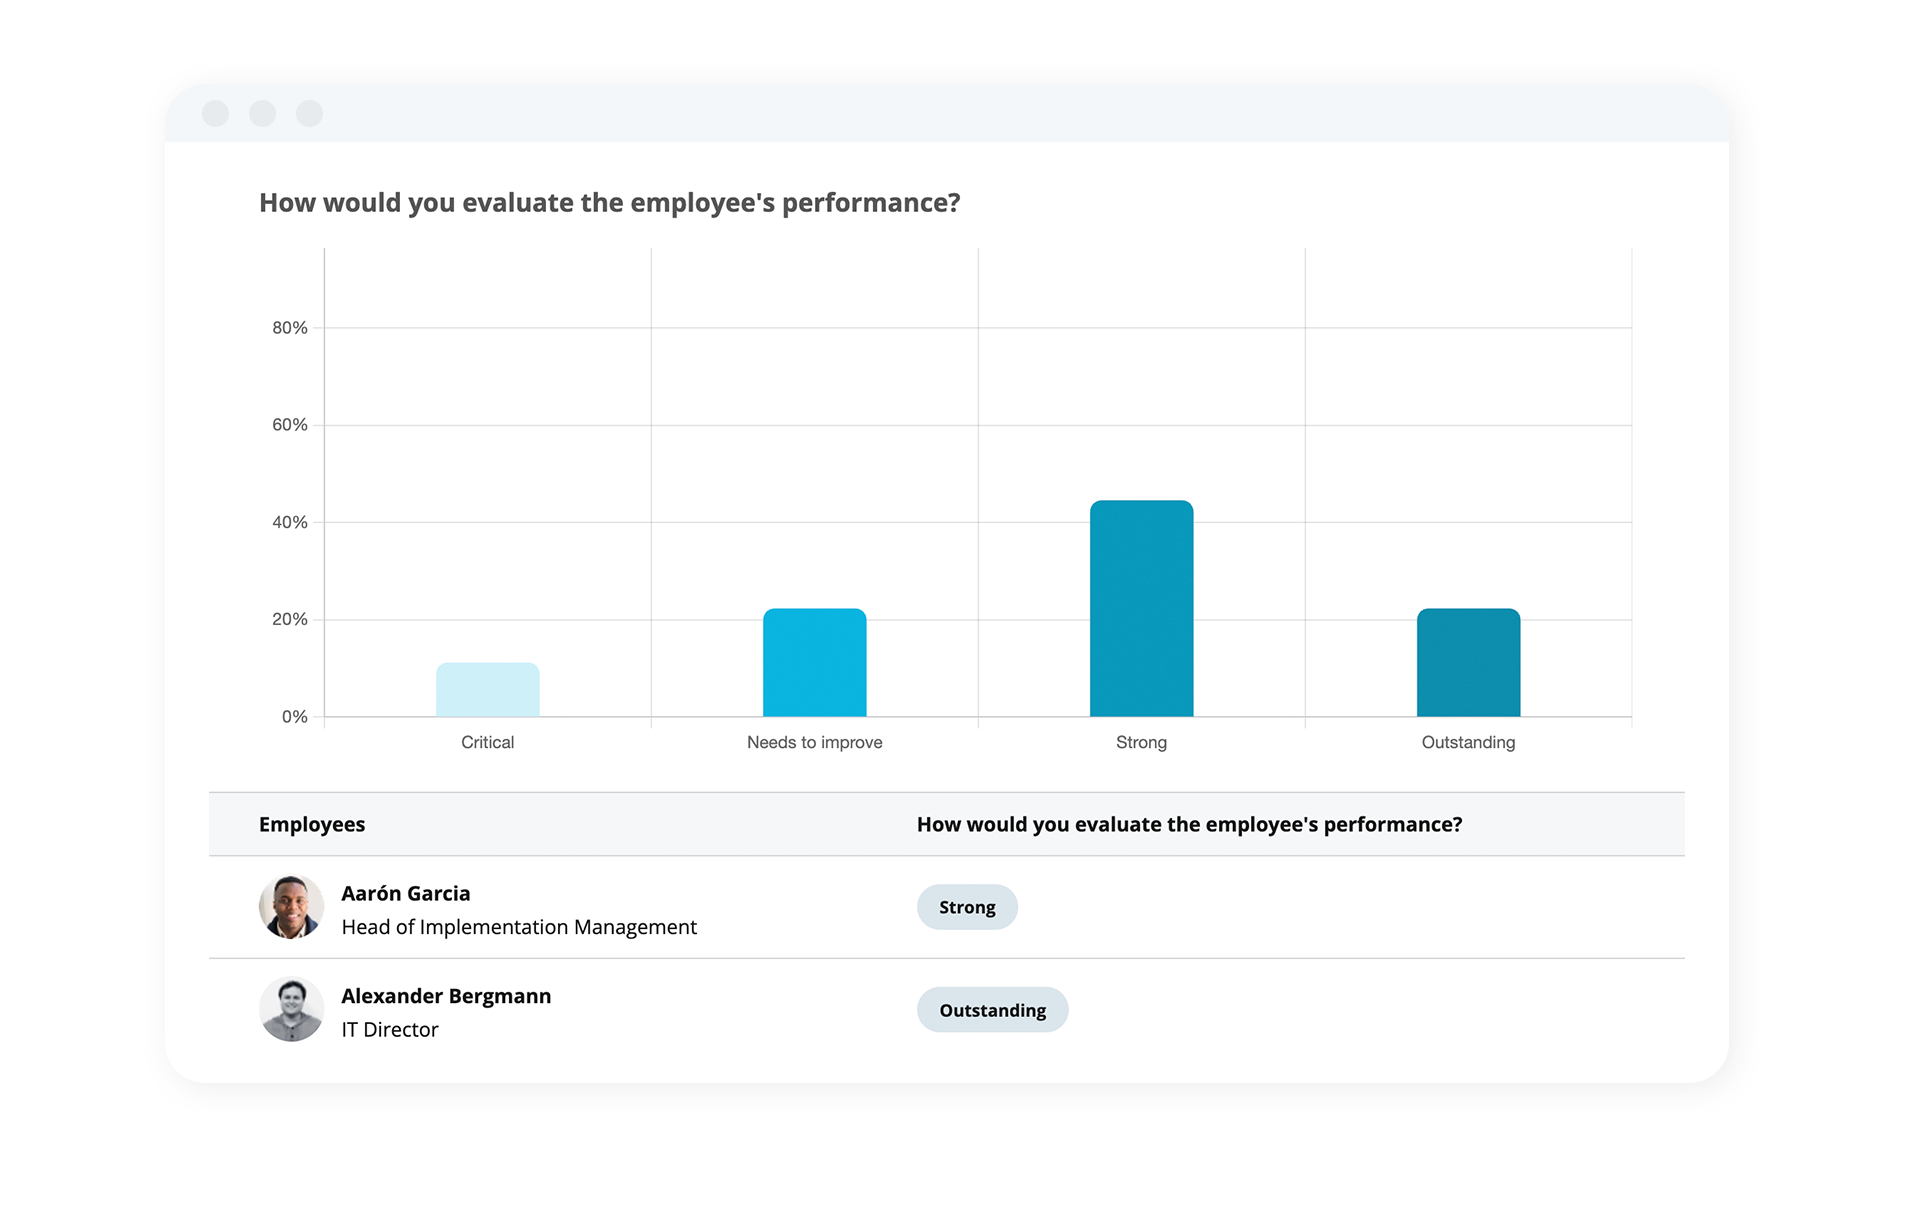
An employee performance dashboard helps HR and business leaders assess key employee-related metrics. Usually measured with key performance indicators (KPIs) or objectives and key results (OKRs), an employee performance dashboard shows leaders whether employees are meeting their goals effectively. This typically shows employee ratings, wages and employee engagement.
2. Workforce demographics dashboard
How balanced is your workforce? Using a workforce demographics dashboard, HR can see the bigger picture, such as what percentage of employees are in a certain age bracket, how many nationalities are represented or how your gender balances compare. You may even consider analysing data on education levels vs. income, sexual orientation and salaries by market, geography, role or gender.
3. Gender salary comparison dashboard
A gender salary comparison dashboard helps HR leaders and business executives compare the salaries of different genders to get an accurate picture of how women, men, or non-binary people are reimbursed in your organization. This can often be extremely eye-opening and a good wake-up call to improve equality and diversity at work.
4. Executive HR dashboard
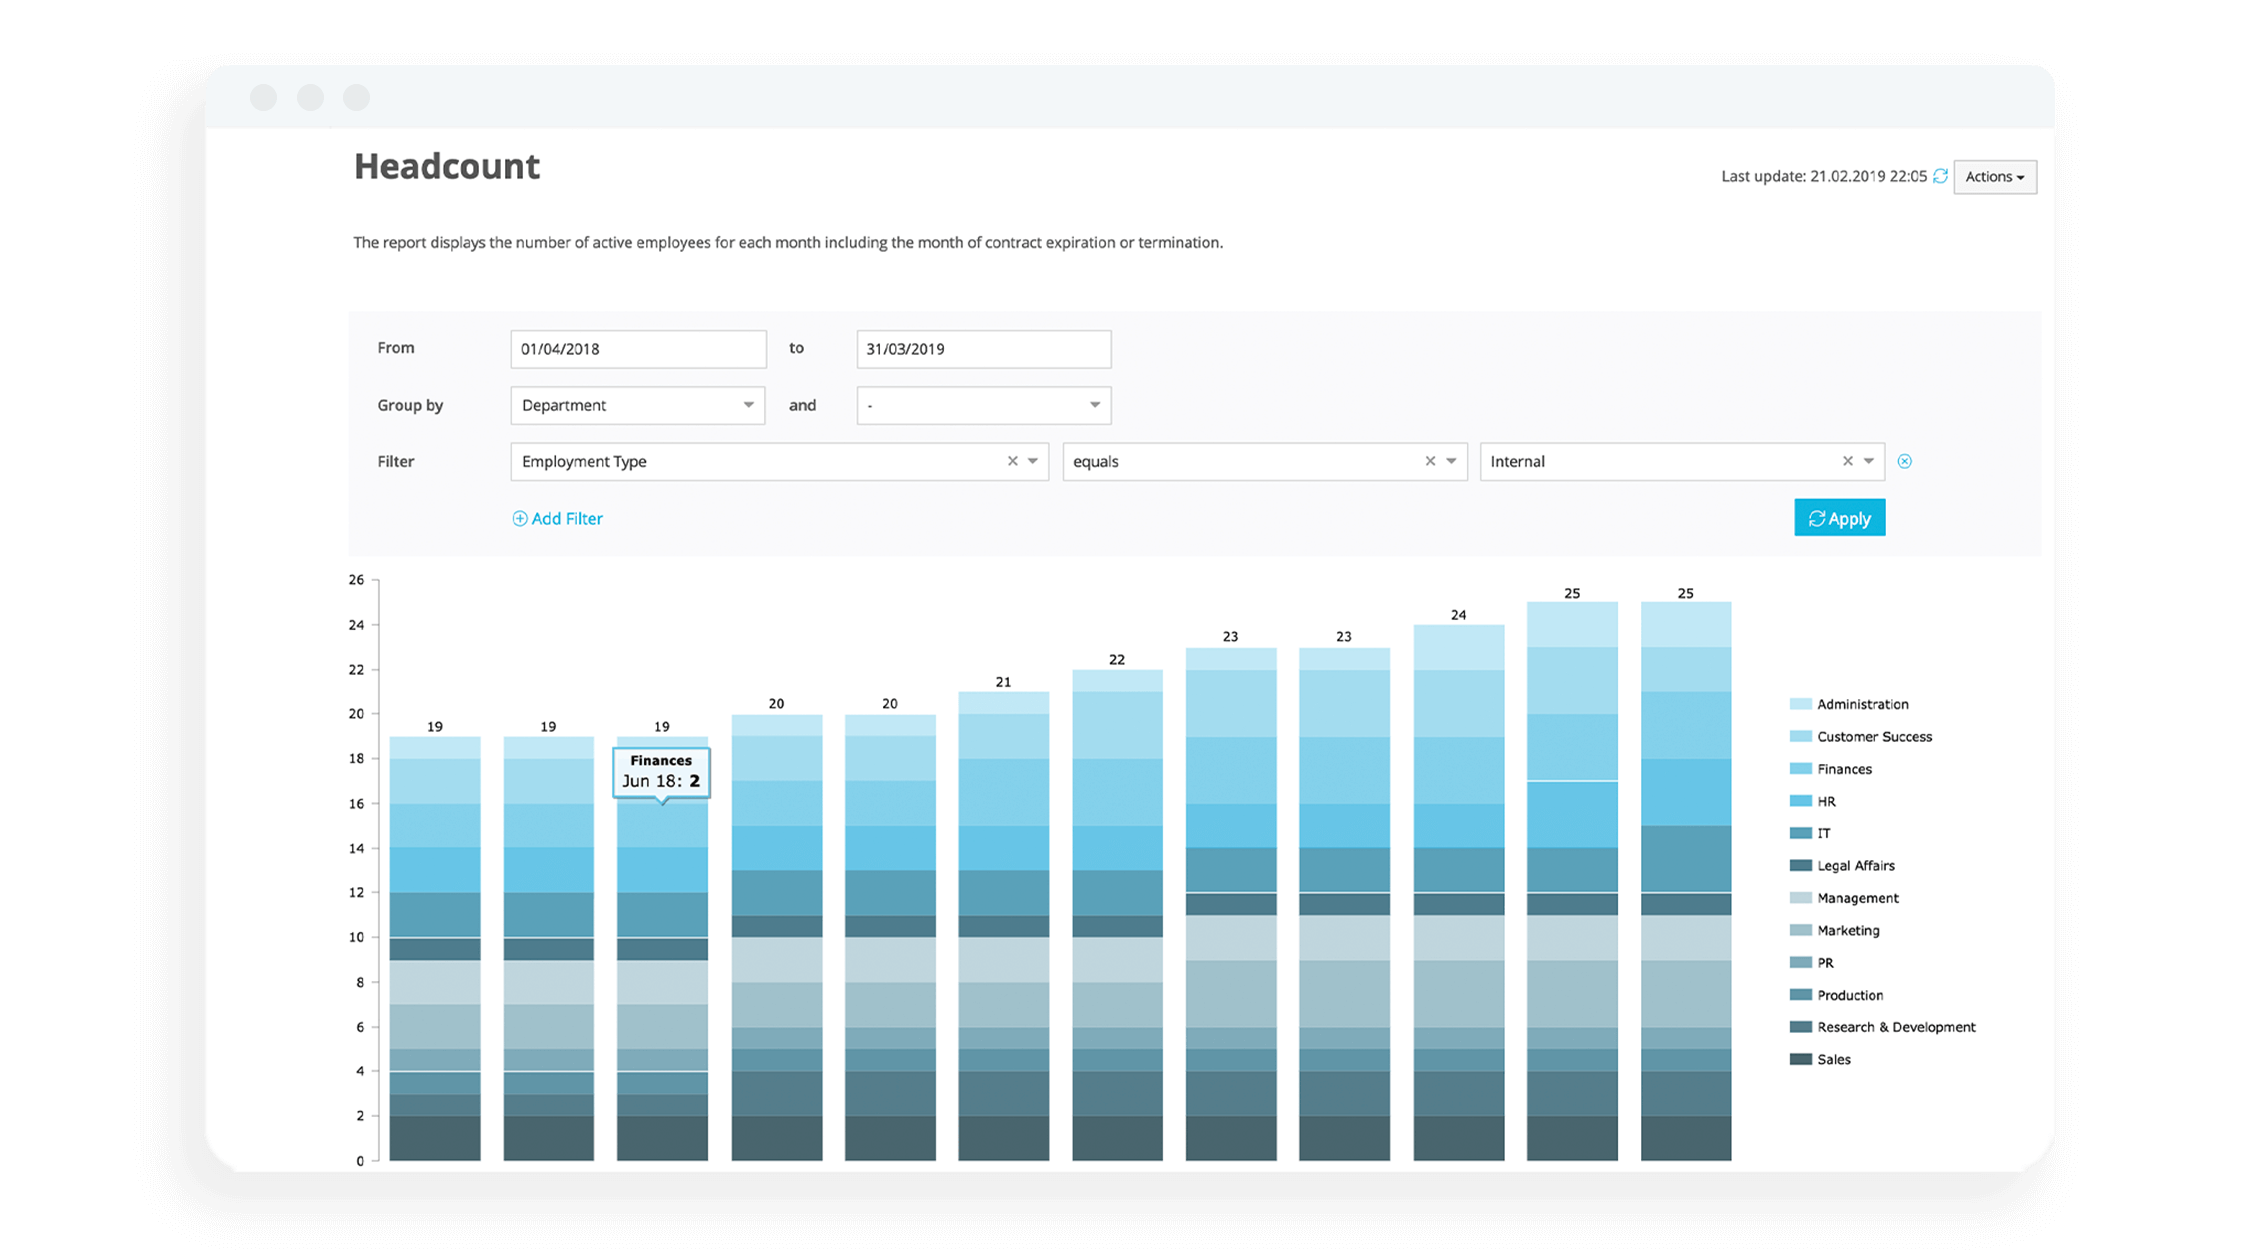
An executive HR dashboard provides a bigger picture of employee-related information. It can include information like: How many employees you have, where they are based, what the hiring/leaving ratio is, what your employee satisfaction score is, how many have completed training and even what salaries are, on average, over time or by division.
5. Team role dashboard
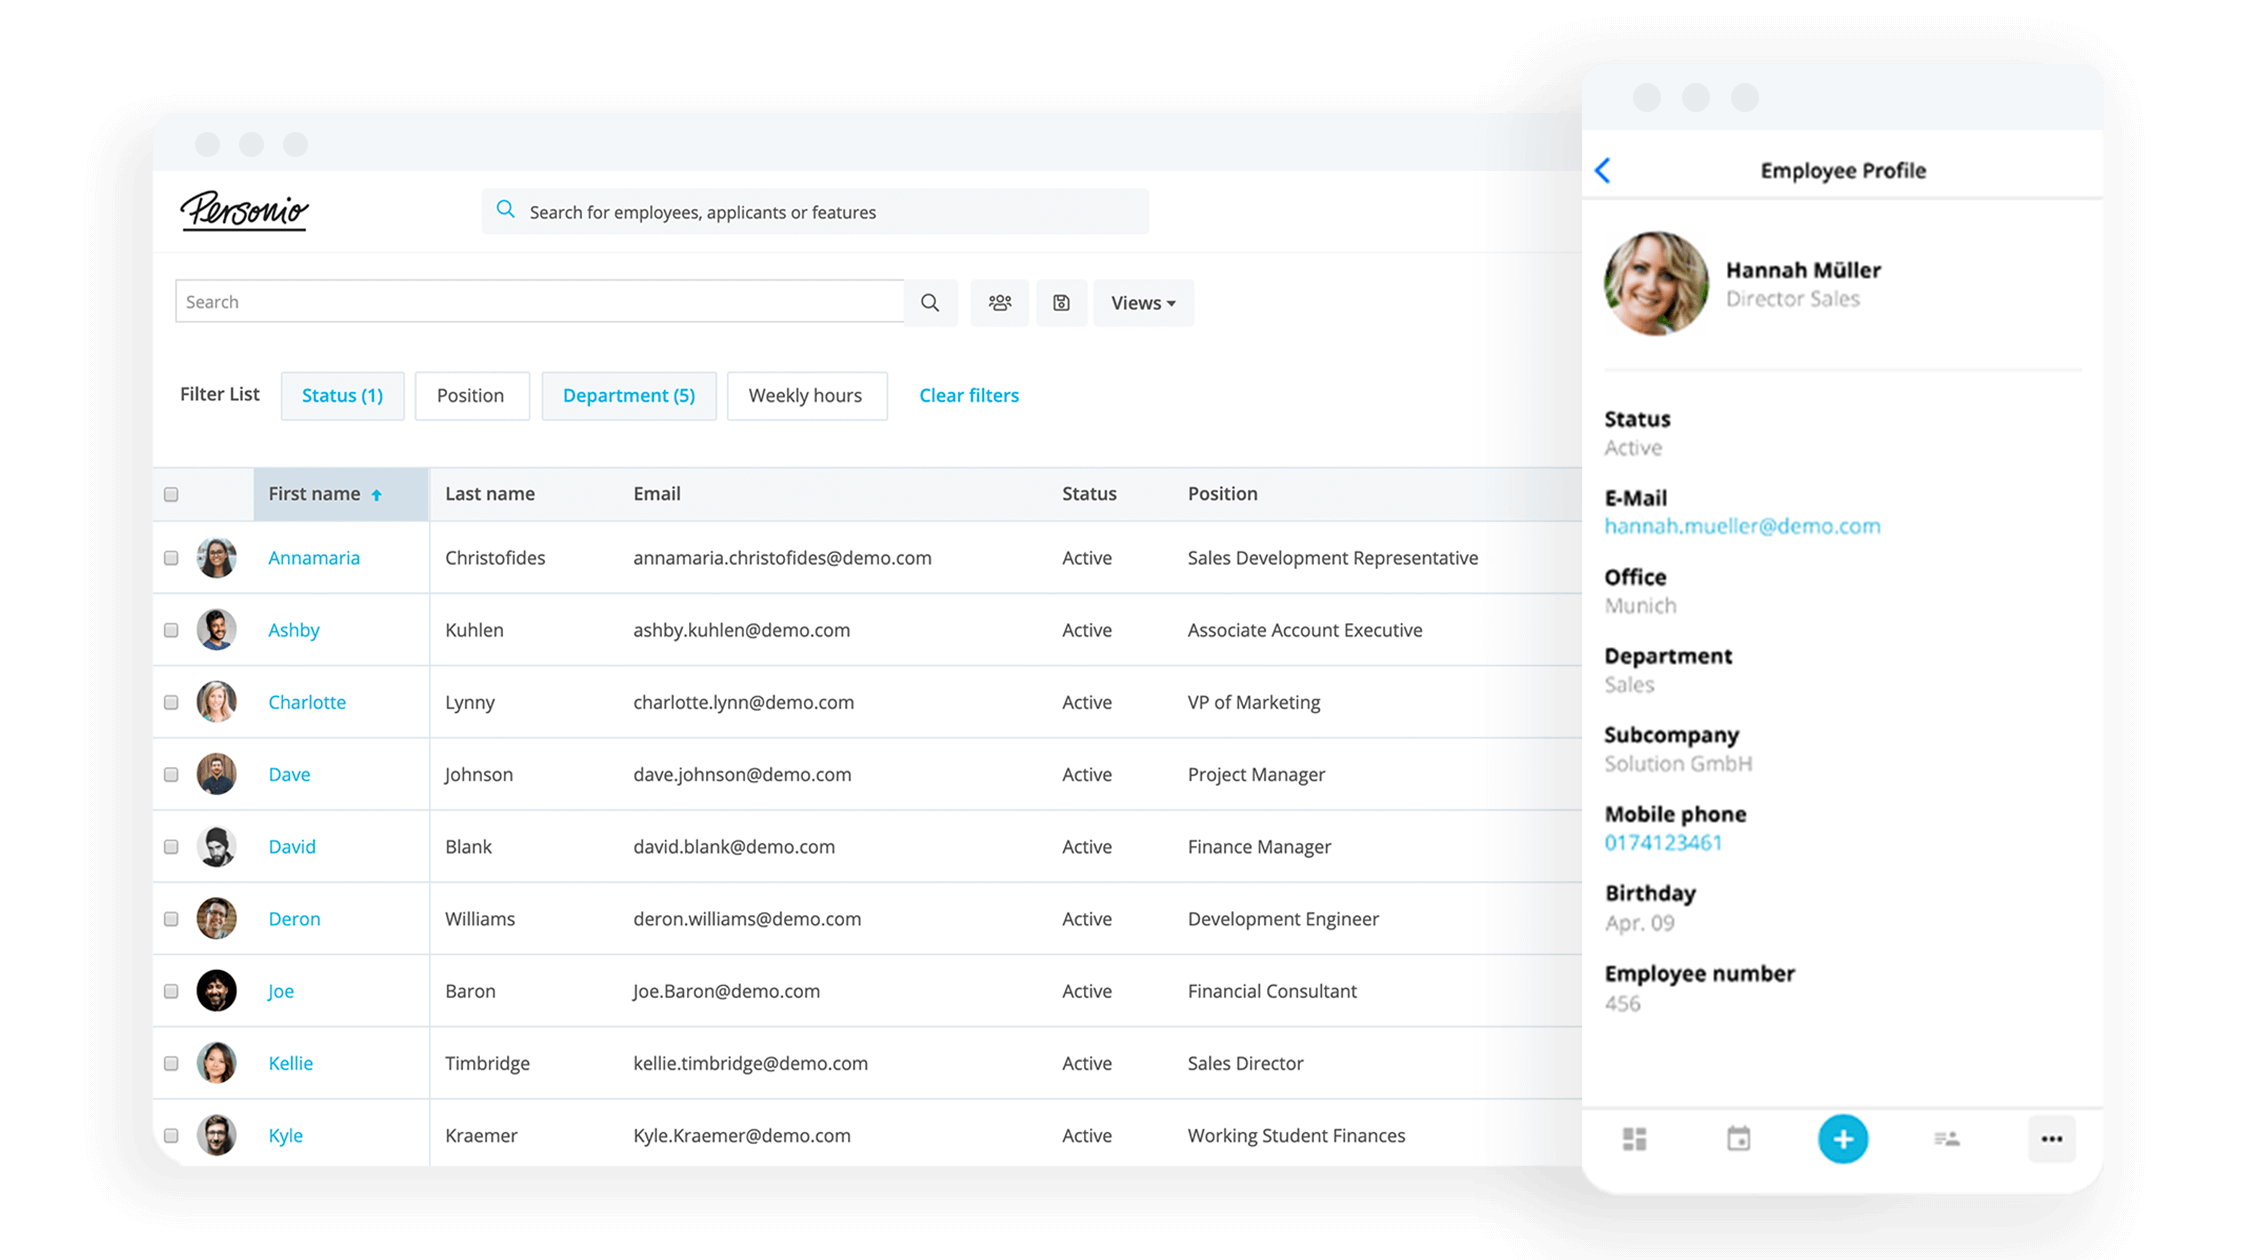
A team role dashboard is helpful to keep track of what’s going on with larger teams or help a manager see team performance at a glance. This dashboard pulls together relevant metrics about team performance and individual roles. It amalgamates KPIs relevant to only their team and can be as diverse or unique as the manager desires. For example, a team role dashboard may include group OKRs, training, holidays, satisfaction scores and even team-specific goals that roll into the bigger management picture.
6. Employee development dashboard
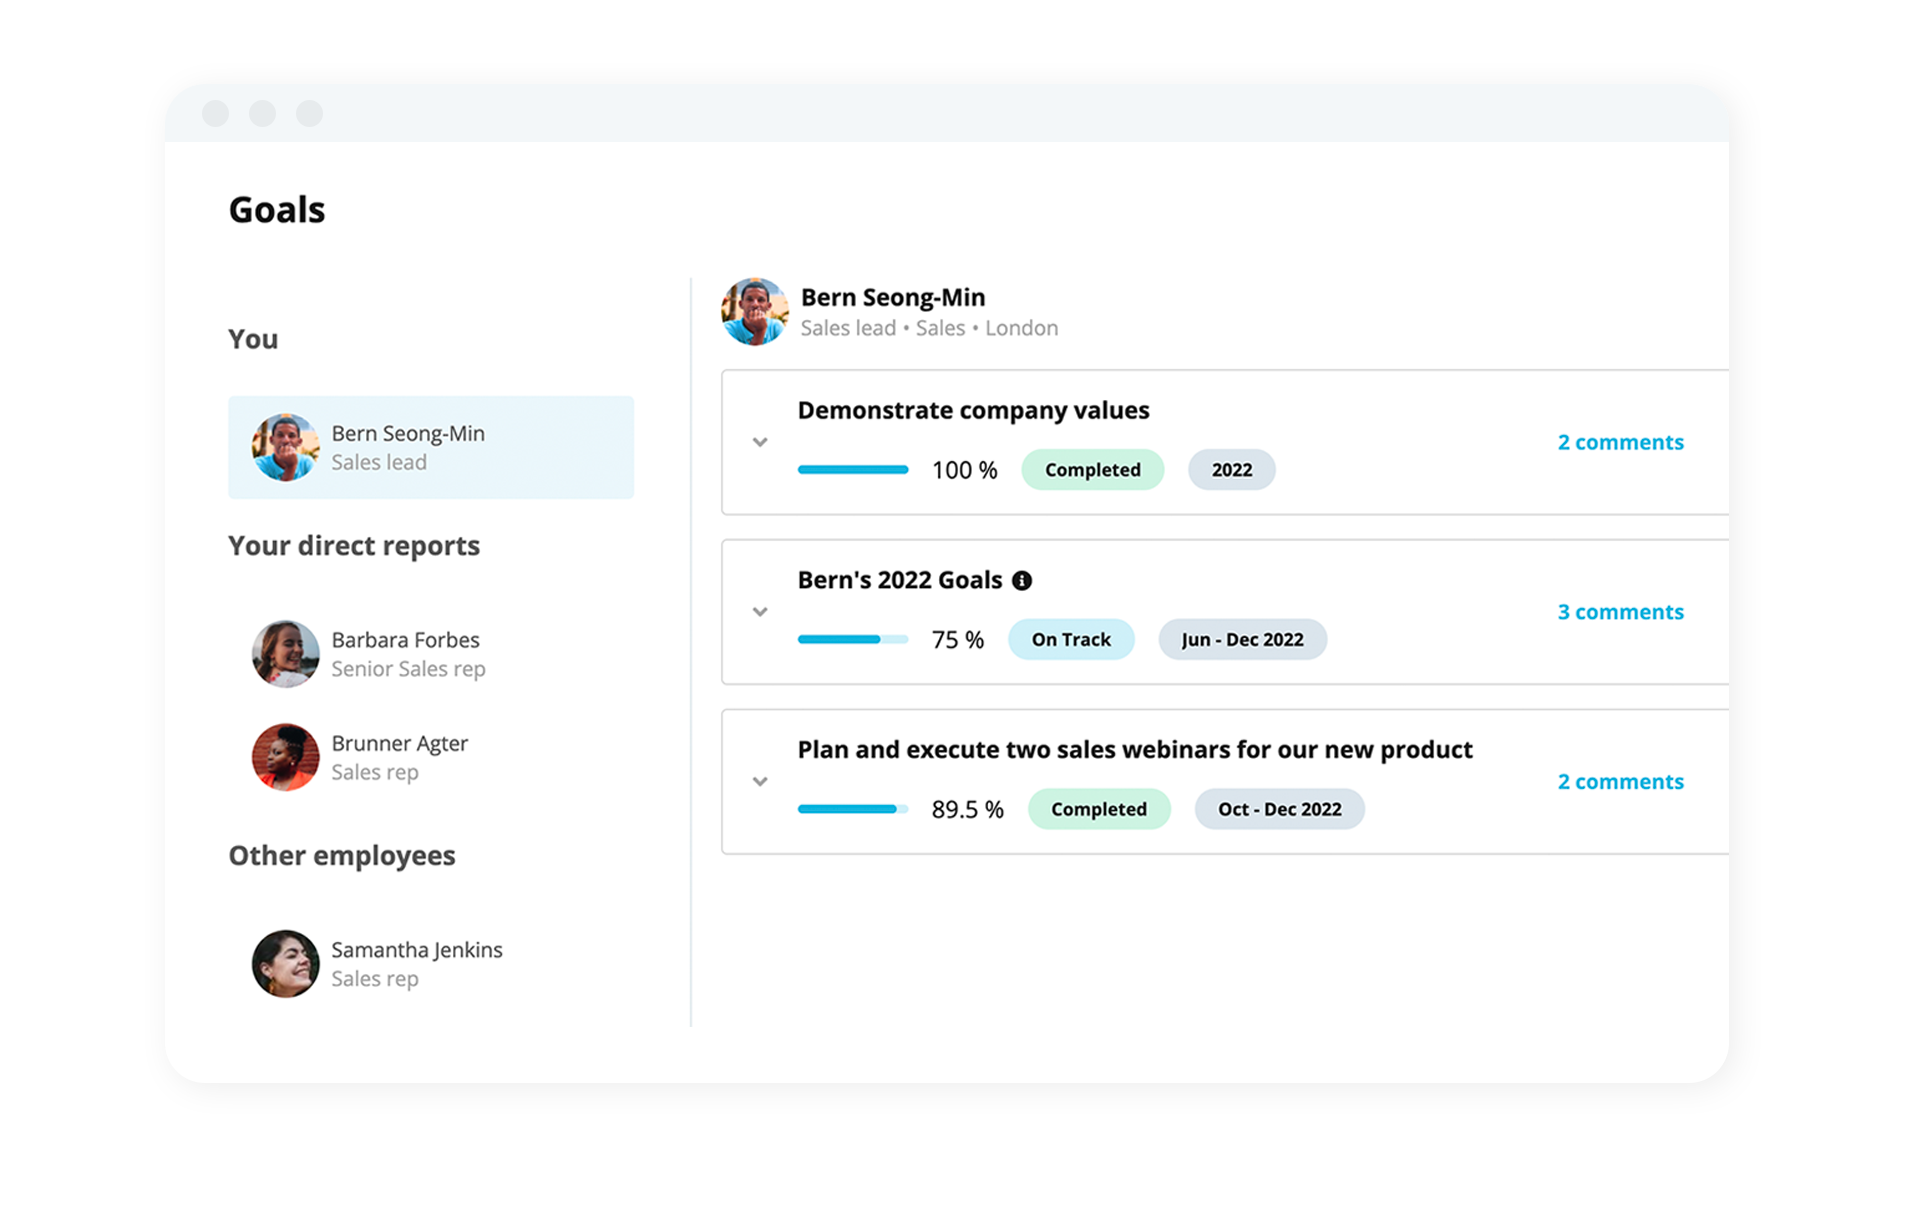
If your employees are undertaking training, an employee development dashboard can show you how well this training is progressing. For example, you might expect employees to complete mandatory health and safety training by a specific date. This dashboard could show the number of programs undertaken, the training cost, how many hours have been completed and the percentage of employees who have finished.
Enable Data-Led Decisions
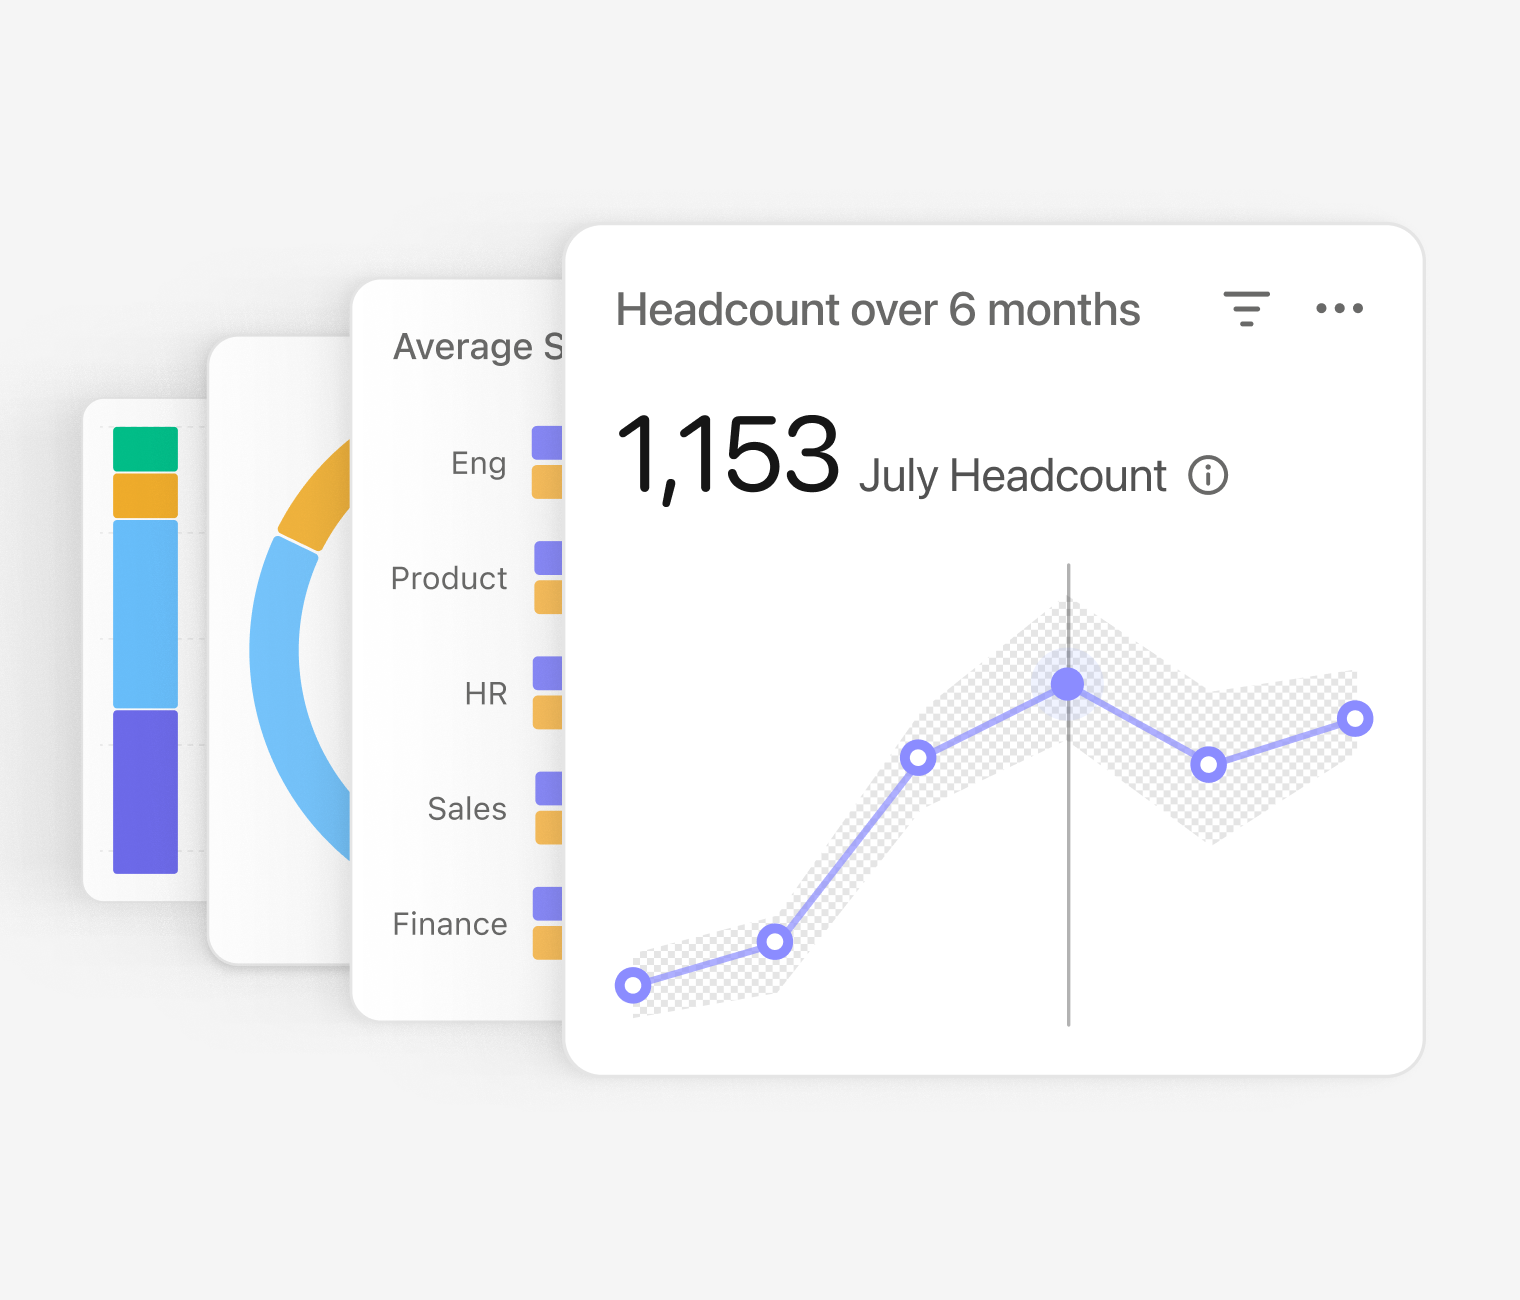
Collect and organise important HR insights such as absences, attrition, and more. Generate detailed reports in seconds so you can strategise with confidence.
Unlock detailed HR analyticsKPIs and metrics for an HR dashboard
An HR dashboard can include any of the following person-specific variables, as long as you have the data available from original sources:
Age
Gender
Seniority
Role
Education level
Type of employment (e.g., full-time, part-time)
Holidays/vacation days available, taken and remaining
HR dashboards can also include metrics that aggregate other data, such as:
Headcount
Breakdown of headcount by employee type, department, etc.
Employee turnover
Number of new hires
Absenteeism rates
Training costs
Employee sickness and absence
Overtime hours/costs
Diversity statistics
Recruitment costs
Employee satisfaction level
Employee performance level (also known as a ‘talent matrix’)
Time to fill a role
Cost of labour (including employee benefits, taxes, and payroll)
You can also build or use hiring-related dashboards to see how well your recruitment process is working. These HR dashboards will likely include information like:
Number of open jobs
Time to hire
Hiring source
New hire turnover
Recruitment cost per hire
Offer acceptance rate
How to build a human resources dashboard
A great platform will always beat a spreadsheet. That's because your HR dashboard deserves a real-time, up-to-date solution that allows your teams to quickly and easily access more information and insights by digging deeper.
Here are some of our top tips and best practices for creating a great HR dashboard:
Choose the right platform: Opt for an all-in-one HR solution (and dashboard) that can report on every element of the employee lifecycle.
Prioritise automation: Enjoy a software that has the ability to automate and pre-create dashboards that saves time and gives you greater insights.
Focus on relevance: Include only the most essential HR metrics to keep the dashboard concise and actionable. Align with executives for what they might want to see.
Effective data visualisation: Rely on charts and graphs to make complex HR data more understandable, especially at a glance for high-level stakeholders.
Maintain data accuracy: Regularly update data sources to ensure accuracy. This can be done with elements of employee self-service and data security.
Review, refine and iterate: Continuously evaluate and improve your HR dashboard's effectiveness based on user feedback.
An HR dashboard that grows with you
Personio is the better way to provide the reliable data, statistics and percentages your business needs to make better HR-related decisions that drive business forward.
Our HR software proffers all the necessary data in one place to access current information in only a couple of clicks. Ultimately, it can form a sound basis for your strategic HR-decision making.
Better yet, our HR software pricing is designed to be built around your team's unique. It's the core tasks and processes that you need to run well, as well as all the additional features to continue benefiting your organisation today, tomorrow and into the future.
If your company needs an HR dashboard that can grow with you, maybe it’s time to consider the power of Personio’s HR analytics software. Book a demo now or start your free trial today.
